 ‘Safe’ is an interesting word, in that it means different things to different people. To the public, ‘safe’ often means ‘cannot fail’, whereas to an engineer, it only means that something is within the accepted safety standards. An example is a commercial passenger jet. Of course they are safe! Commercial air travel is probably the safest form of transport in terms of statistics, yet every now and again a passenger jet does crash. In the field of nuclear power, the same applies. Of course engineers do everything practical (within economic constraints) that they can think of to make nuclear plants safe. Yet, every now and again, something does go horribly wrong. And when it does go wrong, the consequences are felt by thousands of people, and by generations still to come.
Measuring safety
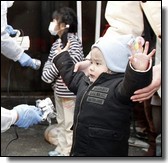
 Safety is often measured in terms of the expected chances of various events occurring. For example, the probability of a flood of a certain size can be described in terms of how often it is thought such a flood would occur. A ‘hundred year flood’ would mean a flood expected to occur once every hundred years, on average. For an earthquake, if we knew and understood precisely the tectonic plates and their composition and movement, we could predict exactly when and where earthquakes would take place. Unfortunately, we don’t have this knowledge, and so we have to resort to guessing based on the data available. For example, in Japan, a magnitude 9 earthquake and 10m tsunami was considered so unlikely, that the nuclear plant at Fukushima was not built to withstand what happened in March 2011.
What if we don’t want to guess?
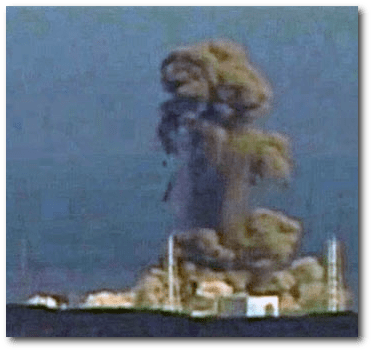
Past behaviour is considered a good indicator for future behaviour, and so another approach is to look at historical data. If one groups together all incidents which resulted from unexpected situations, whether earthquake, operator error or equipment failure, it is easy to get a count of these. The first place you may think of looking, is the International Atomic Energy Association (IAEA) website. Amazingly, they collect incident reports, but do not make any statistics or raw data available. But The Guardian published statistics which use the INES scale to rate the severity of the accident. INES 4 is defined as an accident involving significant damage and “high probability of significant public exposure” to radiation, and both Fukushima and Chernobyl were INES 7 events, the highest number on the scale.
A simplified analysis
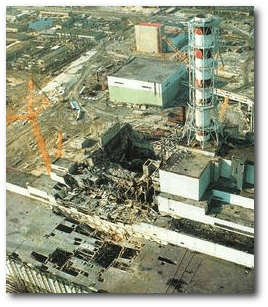
The Guardian lists 11 accidents rated INES 4 and above (Fleurus, Tokaimura, Tomsk, Saint Laurent des Eaux, Jaslovské Bohunice, Fukushima, Three Mile Island, Windscale Pile, Chalk River, Kyshtym, and Chernobyl). According to the IAEA, there are about 440 reactors worldwide, so a simplified analysis is 11 out of 440, or 2.5% of civil reactors have had serious accidents.
Accidents per operating year
 According to world-nuclear,org, by 2011 there had been a total of about 15000 total reactor operating years. Dividing by 11 accidents gives one accident every 1400 operating years, or 0.0007 accidents per operating year. With 440 reactors in operation, 1400 operating years will occur in about 3.2 calendar years. That means at current level of nuclear power use, based on history we should expect a serious accident (INES 4 or above) every four years.
If we consider only the two INES 7 accidents, the same calculation will show we have had one such incident per 7500 operating years. With 440 reactors, we should expect one such incident every 17 years.
When next?
By these figures, another large scale accident is likely to happen before 2018. With each disaster, safety precautions are hopefully gradually improved, which may increase the time before the next disaster. On the other hand, as more nuclear reactors are built, the operating years per calendar year increases, which will tend to decrease the time before the next disaster.
 The nuclear industry has recently avoided making numerical predictions, perhaps having learned from now infamous quotes such as Carlos Rojas-Palmas in 2004 saying “The chance of another nuclear disaster like Chernobyl is less than one in 10 million”. A disaster of the same scale happened just 7 years later in Fukushima. Another reason is because any figure is a source of ethical difficulty. Is it ‘ok’ to have a Fukushima every 50 years? Every 500 years? These are question that lead us to think that it is not defensible to hide the catastrophic nature of nuclear disasters behind statistical technicalities. It’s a risk we should not contemplate taking. Yet another reason for avoiding quantifying risks is that when these theoretical predictions are compared with the actual track record of nuclear, they are found to be very different.
Conclusion
Modelling risk takes into account all expected risks. It is the unexpected risk factor, which by definition cannot be modelled, that should make us wary of reassurances from the nuclear industry about the predicted safety figures. There is one safe way to deal with nuclear reactors – don’t build them.
—
References:
The World Nuclear Industry Status Report 2010–2011, M Schneider et al.

I would like to help you.? Have lots of Potassium Iodide 130mg pills at 30 cents each. US shipment is 8 dollras no matter how many you order (shipping worldwide). 10% from selling goes to Japan so I think it is not bad I am announcing here. Please provide your needs and shipment details via private message. Have some background in field of nucclear physics (technical university lectures). Will gladly answer your questions. Take care:)